


As of last year, 15.7 percent of employees in Belgium held foreign nationalities. Despite years of steady growth, this figure saw a slight decline of 0.1 percentage points, as reported by
recruitment agency Acerta on Thursday. However, there's a notable exception to this trend: the healthcare sector, which has witnessed a 2-percentage point increase.
While the overall proportion of non-Belgian workers in the labor force has remained relatively stable, holding steady at 15.8 percent since 2022, specific sectors have faced acute shortages, prompting increased reliance on foreign workers in recent times. This reliance led to a steady rise in the share of foreign workers from 12.6 percent in 2017 to 14.8 percent in 2021.
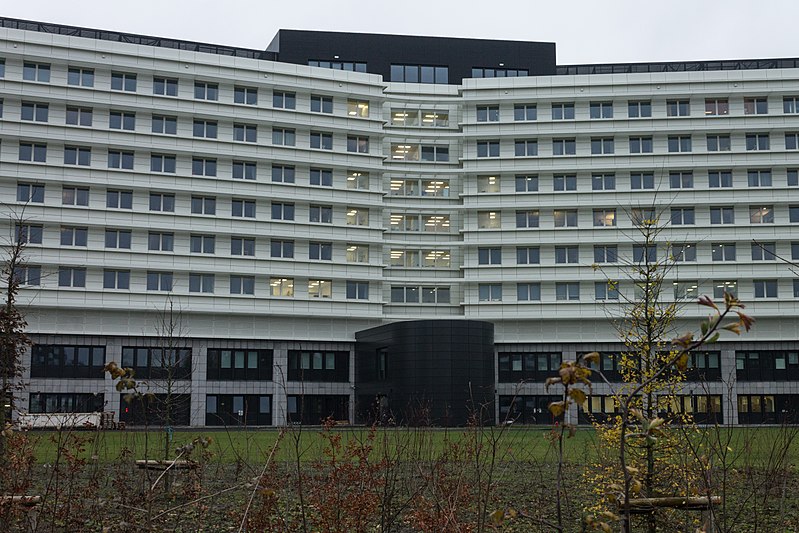
Despite the overall stagnation observed in 2023, the healthcare sector continues to witness a rise in the share of non-Belgian workers. Currently standing at 10.2 percent, it remains below the average but reflects a significant increase from 6.4 percent a decade ago.
Blue-Collar Dynamics
The largest concentration of non-Belgian workers is found in the healthcare and social work sector, constituting 23 percent of the workforce, compared to 9 percent among white-collar workers. Acerta attributes this discrepancy to the nature of tasks performed, noting that blue-collar roles often involve duties less directly related to caregiving, such as cleaning, kitchen duties, or technical services, where language, culture, and qualifications play a lesser role.
Language Influence
The language factor also contributes to the disproportionate presence of non-Belgian workers in Wallonia compared to Flanders. The report notes that the larger French-speaking area outside Belgium makes it relatively more challenging to work in Flanders than in Wallonia.
Representation by Nationality
Dutch nationals constitute the largest segment of non-Belgian workers in the healthcare sector, accounting for 26.1 percent, followed by the French (22.2 percent), Moroccans (13.3 percent), Germans (10.2 percent), and Congolese (8.8 percent).
Across all sectors, the most represented nationalities among foreign workers are French (18.4 percent), Dutch (16.4 percent), Moroccan (16.2 percent), Romanian (15.6 percent), and Polish (12.7 percent). Photo by Frieda De Bouver, Wikimedia commons.